Quarter Update as of September 30, 2024
Summer 2024 Occupancy 3% Lower than 2023
Central Counties Tourism collects aggregated quarterly hotel data from Co-Star (formally known as Smith Travel Research (STR)) for the available properties within our region, and each quarter, share those metrics with you.

The summer season (Q3: July – September) is our peak season which sees the greatest number of visitors into the region, refer to the table below. Unfortunately, this past summer’s hotel occupancy fell 2.9% short of summer 2023’s occupancy percentages and 1.0% below 2019’s Q3 levels. Though these slight decreases mean fewer hotel rooms were filled, lower ADR and RevPAR, as well the revenue received during the quarter was 3.0% less than 2023’s quarter. However, due to a very strong Q1 in 2024, the YTD Occupancy level was only 1.3% lower vs 2023 YTD and 2.0% higher than 2019 YTD, and the revenue received 2024 YTD was 4.9% higher than 2023 revenue.
Despite lower 2024 Q3 values vs 2023 Q3, the differences are only slightly less, and still within the average range.


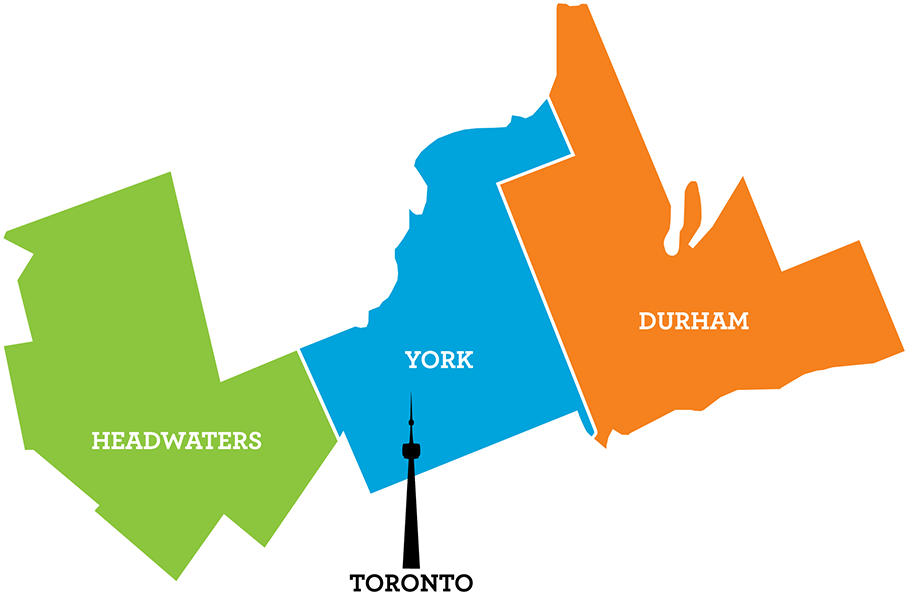
Click on the regional hotel reports below to see the Occupancy, Revenue, Average Daily Rate and Revenue Per Available Room for:
For further assistance in identifying your target markets, please contact Tom Guerquin, Manager of Research & Development at Central Counties Tourism.