As Chuck said during the Symposium, 2022 visitor numbers are in, and they continue to look promising.
Last month we saw positive hotel stats, and in this month’s issue, we will continue to look at our Domestic Overnight Visitors from 60+KM dataset through the lens of our six visitor segments: Adventure Seekers, Art Lovers – Urbanite (Core), Art Lovers – Community Explorer (Tactical), Family Fun, Foodie Fanatics, and Passionate Putters.
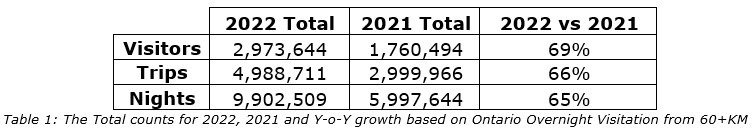
Visitation from our domestic overnight visitors from 60+KM in 2022 continued to increase year-over-year, with a 65-69% growth from 2021 in our Ontario market. Ontario continues to offer our highest ROI for domestic visitors as it represents approximately 80% of this dataset. In addition to seeing an increase in visitation and knowing which markets to target, also discussed in last month’s newsletter, we will now look at the ‘who?’
Besides being a great band, the who are our six segments: Adventure Seekers, Art Lovers – Urbanite (Core), Art Lovers – Community Explorer (Tactical), Family Fun, Foodie Fanatics, and Passionate Putters. You see them mentioned in our marketing collateral, but let’s do a deep dive into them through data. These profiles were created based on extensive research, and provide a great representation of both our past visitors and the products/services that entice and promote the visitor experience throughout the region. Within this dataset, we look at the # and % of three variables: visitors (unique visitors), trips, and nights (we use the ‘Nights’ variable to count the number of overnight visits).
A recap example: 1 Visitor / 50 Trips / 100 Nights = I made 50 overnight trips within the Central Counties Tourism (RTO6) region and stayed two nights per trip at a hotel/Airbnb/friends/other that was over 60KM away from my house.
The key takeaways to increase your ROI:
1. Continue to market to the same segments.
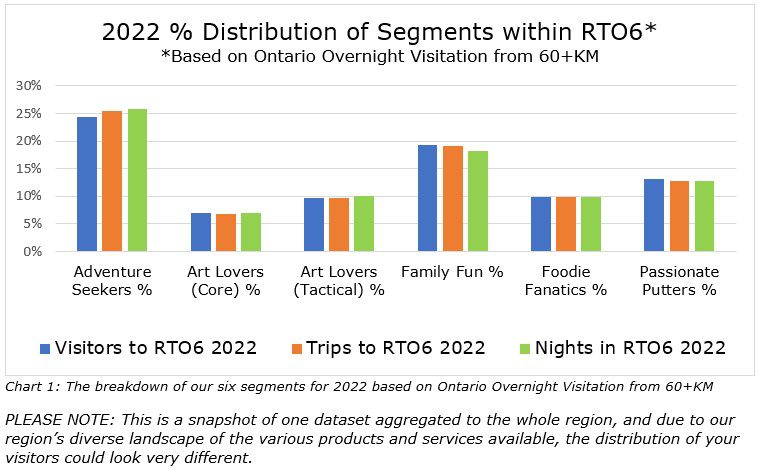
- The overall distribution of our profiles has stayed fairly consistent throughout 2019-2022, meaning that our visitor types have not changed and have remained loyal to our region.
- Adventure Seekers continue to represent a quarter of our overnight 60+KM visitors, followed by Family Fun at 20% and Passionate Putters at 13%.
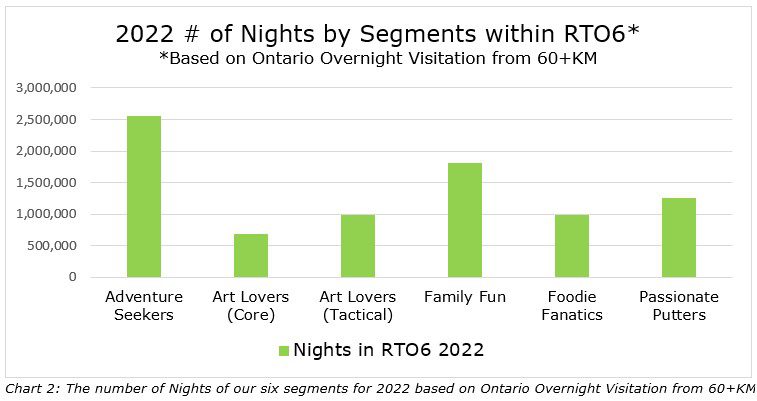
2. The highest number of nights in RTO6 were from Adventure Seekers
- Of the approximate 10-Million nights spent in RTO6 from Ontarians who travelled 60+KM, Adventure Seekers spent 2.6-Million nights, followed by the Family Fun segment at 1.8-Million Nights, and Passionate Putters at 1.3-Million nights.
- Though the Art Lovers and Food Fanatics segments did not make as many overnight trips when compared to the other segments, these profiles could be mostly same-day travellers, and thus not accurately reflected in this chart.
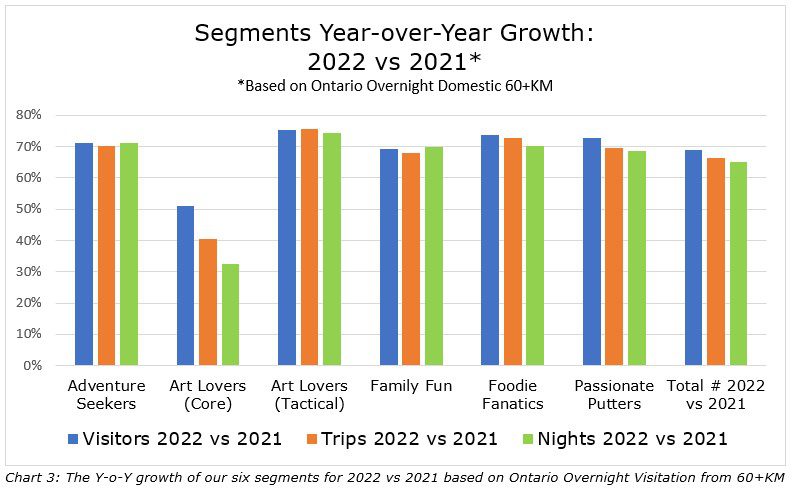
3. Overall, 2022 vs 2021 saw increases of 65-69%.
4. Art Lovers Community Explorer (Tactical) had the highest Y-o-Y growth at 75%, as shown below.
- Though this segment doesn’t have the highest counts, it saw the greatest growth in 2022 vs 2021 for the number of visitors, trips and nights
- The other segments also saw increases of around 70% – excluding Art Lovers – Urbanite (Core) which saw growths of only 33% to 51% (this segment’s characteristics indicate that they live in vibrant metropolitan areas, which are within 60KM of our region and likely same-day travellers).
Overall, based on the 2022 overnight visitation data (the hotel data published last month and above from 60+KM), the distribution of our segments has stayed the same; the segments Adventure Seekers, Family Fun and Passionate Putters produce the highest number of overnight 60+KM visits; 2022 vs 2021 experienced a growth of 65-69% for the number of Ontario Visitors, Trips and Night; and there was a growth of about 70% in all of the segments in 2022 vs 2021 – the highest among Art Lovers Community Explorer (Tactical) and lowest with Art Lovers – Urbanite (Core), though these are same-day travellers from metropolitan areas.
As the data presented here is a snapshot of one dataset that has been aggregated for the entire region, we would be happy to analyze visitation to your individual business or municipality to help you increase your ROI and grow the visitor economy.
For a more detailed description of our six segments CLICK HERE, or email Tom for anything research related – including data about visitation to your business and its segments.