As 2020 is upon us, let’s reflect on visitation over the past year. How did your business perform in 2019 vs. 2018? Were your number of visitors up or down? Did your revenues increase or decrease? Though only you can answer these questions about your businesses, Smith Travel Research (STR) can help answer them for the hotel sector.
In 2019 CCT started collecting aggregated hotel data for the region to answer these questions and many more. This data allows Central Counties Tourism (CCT) and its stakeholders to know visitation trends in the region for overnight hotel/motel visitors.
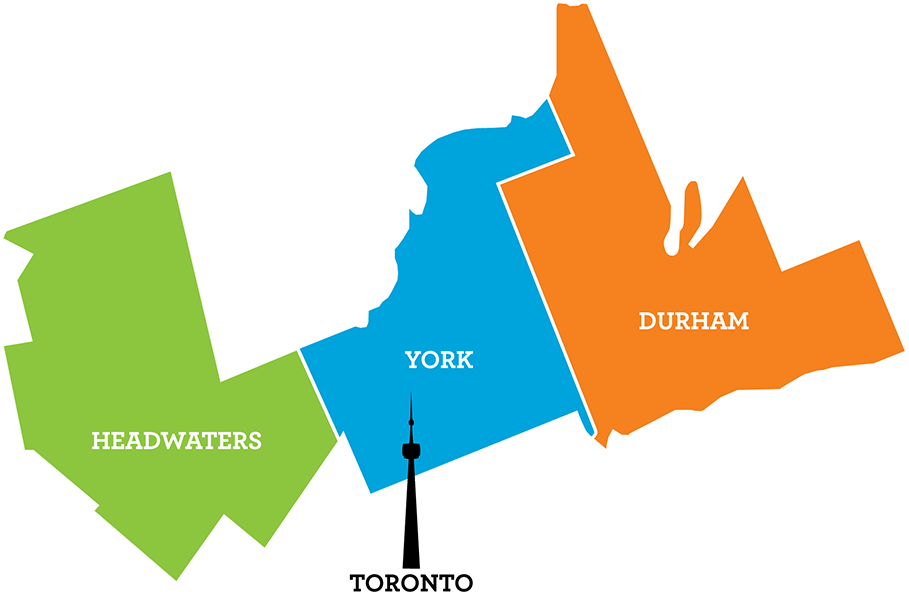
The data below includes approximately 83% of the total rooms in the region, covering about 60% of the hotels/motels in York, Durham, and Headwaters.
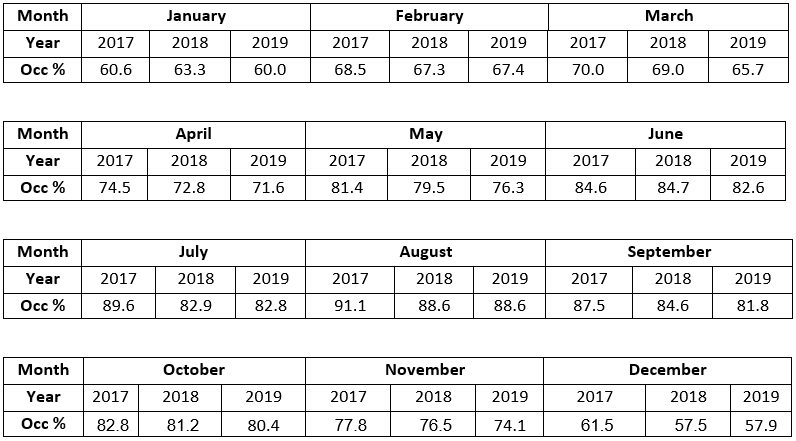
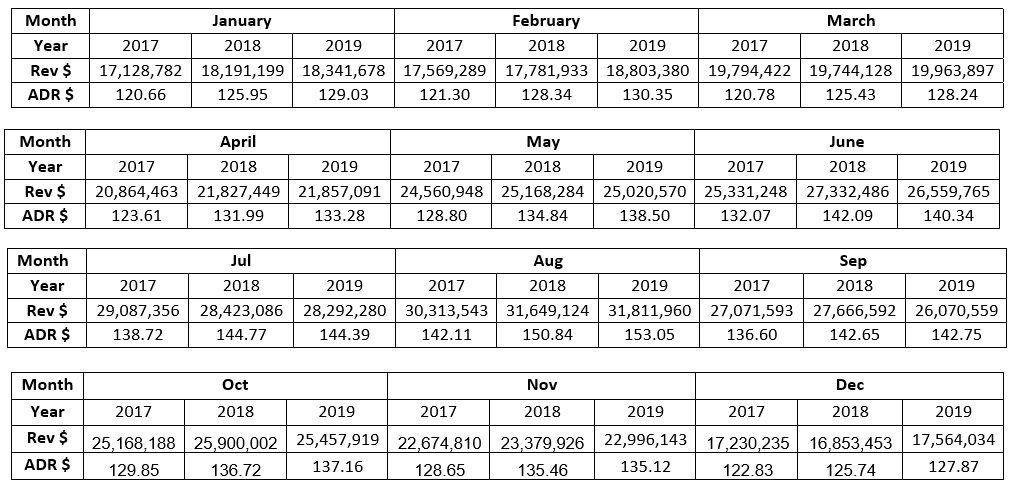
The hotel/motel stats below cover monthly data from January 2017 – December 2019; including Occupancy percentages, Revenue, and Average Daily Rate (ADR).
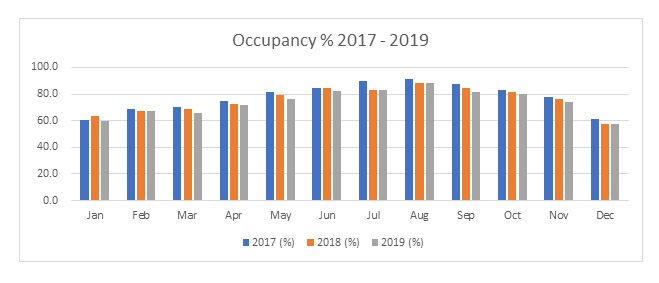 Source: Smith Travel Research
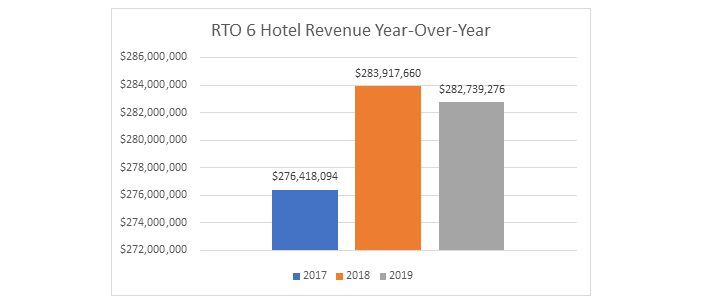
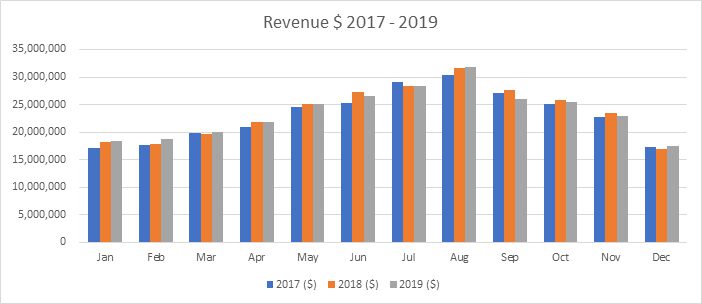
Source: Smith Travel Research

Click each region for a detailed breakdown of 2019 month-over-month: YORK, DURHAM, and overall for CENTRAL COUNTIES.
*Due to limited hotel inventory, STR is not able to provide a breakdown for Headwaters.
For additional hotel/motel stats, information about the Visitor Research Program/Environics, or other research, please contact Tom at Tguerquin@CentralCounties.ca.