Quarterly Hotel Update, as of March 2026 (Q1)
The following analysis of hotel performance within Central Counties Tourism (RTO6) for the first quarter (Q1) of 2026 reveals a complex landscape defined by record-high pricing and revenue, contrasted against a moderate decline in volume (demand).
Q1 2026 Performance Overview
The first quarter of 2026 (January–March) generated total regional hotel revenue of $88,713,337.67. This is the highest Q1 revenue recorded since our reporting started in 2017, surpassing the previous peak of $88.5 million in 2024. However, it is important to note that this growth was driven entirely by aggressive pricing (ADR) rather than by increased visitation, as occupancy reached its lowest Q1 level in four years.
The Average Daily Rate vs Occupancy Paradox
Analysis of the core metrics suggests a shift in the region’s performance dynamics:
- Occupancy Decline: Q1 2026 occupancy averaged 62.1%, a noticeable drop from 66.2% in 2025 and 68.6% in 2024. January 2026* was particularly weak, with occupancy at only 56.2%, about 4-6% points lower than the same month the prior years.
- *Please note: January 2026 was the snowiest January since tracking started in 1937 with 88.2 cm of snow at Toronto’s Pearson Internation Airport; justifying a lower occupancy in January and rolling over into February’s occupancy as well. Weather conditions in Q1 2025 were much milder and lacked the immobilizing blizzards that were seen throughout our region and GTA that impacted travel for our visitors in 2026.
- Record-High ADR (Average Daily Rate): While fewer rooms were filled, those that were occupied paid much higher rates than in the past. The Q1 average ADR rose to $174.94, up from $164.55 in 2025 and $153.24 in 2023. The average rate for March 2026, reached the highest in Q1 history at the average rate of $181.79 per room.
- Stalling RevPAR (Revenue Per Available Room): Because the increase in rates was offset by the loss in occupancy, RevPAR—a key indicator of overall hotel health—has plateaued. Q1 2026 RevPAR was $108.84, which is slightly lower than the $109.11 seen in 2025 and down from the peak in 2024 at $111.53.
Monthly Trends and Growth Opportunities
- March Momentum: March remains the strongest month of the first quarter across all metrics. In 2026, March revenue hit $34,484,484 with an occupancy of 67.6% suggesting momentum into the Spring peak season from the off-season, and of course the March break holiday helped as well
- The “January Slump”: January 2026 showed the most significant vulnerability, with the lowest occupancy (56.2%) and revenue ($26.7M) of the quarter. Addressing this mid-winter dip is critical for annual growth, however, supply in January can be limited as businesses recover from the holidays.
Stakeholder Recommendations for Industry Growth
To help grow the visitor economy based on these trends, stakeholders should consider the following:
- Rebalancing Volume and Value: With RevPAR starting to decline from 2024 peaks, the current strategy of raising rates to compensate for lower occupancy may be reaching its limit. A suggestion for stakeholders to introduce value-added packages (e.g., dining deals, partnering with local attraction, 3 nights for 2, …) to boost occupancy without drastically lowering the ADR.
- Reinvest: Total revenue remains at record levels. Now is the time to start thinking about reinvesting in property upgrades and/or service enhancements to keep people wanting to return each time they visit the region.
- Think Ahead: Given the soft performance in January and February, start planning now for winter 2027. Regional marketing should focus on off-peak incentives to attract business and leisure travelers during these months (depending on available supply).
Summary of Key Points
- Revenue Peak: Q1 2026 saw record-breaking total revenue of $88.71 million.
- Occupancy Warning: Occupancy has trended downward for three consecutive years, hitting a Q1 low of 62.1%.
- Price Resilience: The Average Daily Rate (ADR) is at an all-time Q1 high of $174.94, growing 14% since 2023.
- RevPAR Plateau: Total efficiency (RevPAR) is stagnating at $108.84 as high rates struggle to overcome falling occupancy.
Click on the regional hotel reports below to see the Occupancy, Revenue, Average Daily Rate and Revenue Per Available Room for:
Please note: Daily & Weekly Occupancy % data is also available, providing a more detailed view of demand patterns throughout the year. Check it out here.
For further assistance in identifying your target markets, please contact Tom Guerquin, Manager of Research & Development at Central Counties Tourism.
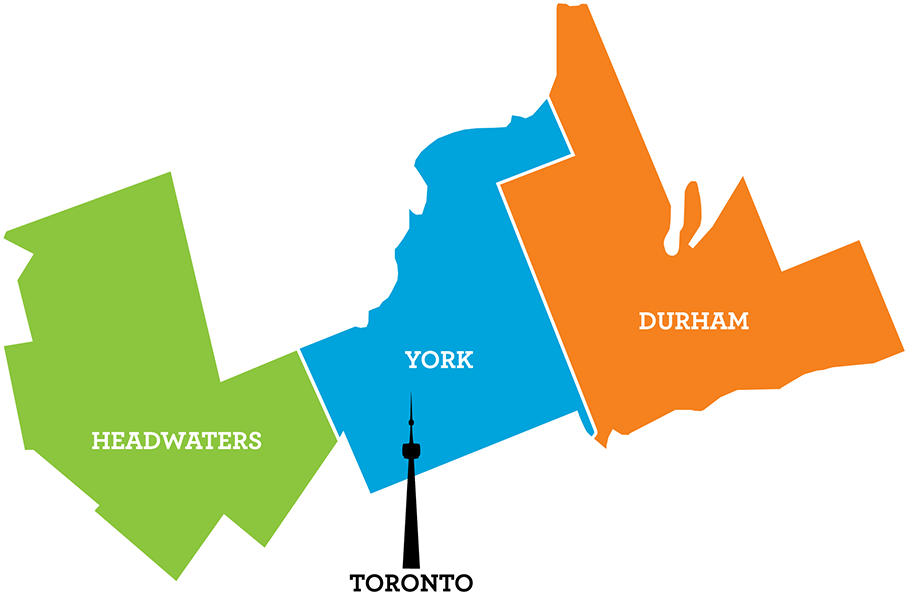
Central Counties Tourism collects aggregated quarterly hotel data from Co-Star for the available properties within our region, and each quarter, share those metrics with you. Headwaters-specific data is not published separately due to limitations in the available dataset, but it is included in the aggregrated Central Counties Tourism dataset.