Quarterly Hotel Update, as of September 2026 (Q3)
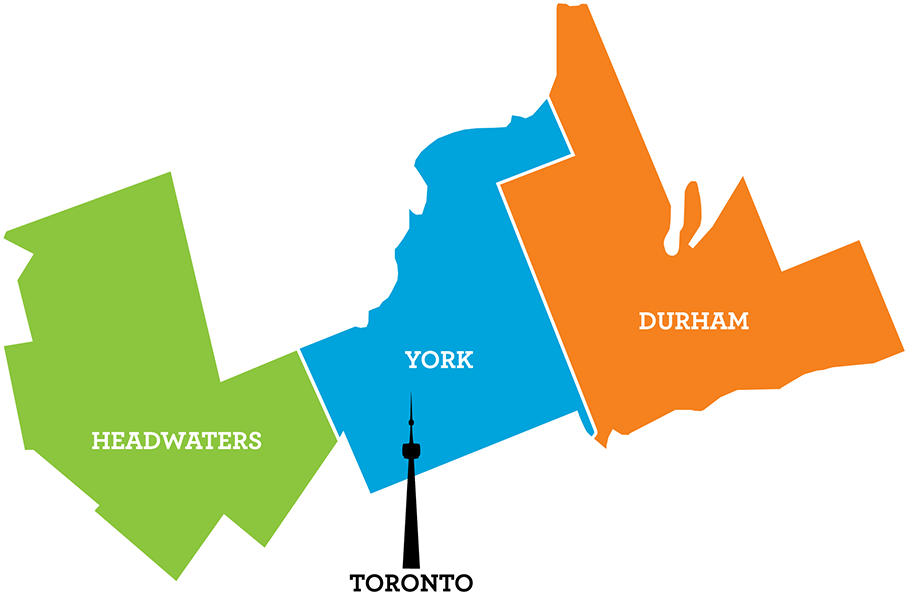
The following analysis of hotel performance within Central Counties Tourism (RTO6) for the third quarter (Q3) of 2026 reveals the highest revenue quarter on record!
Q3 2026 Highlights:
- Occupancy: 81.5%
- Hotel Revenue: $144.1 million (record high)
- ADR: $209.56
- RevPAR: $171.02 (record high)
The summer tourism season (July to September) remained a strong period for our region in 2026. While hotel occupancy was slightly lower than in recent years, the region achieved record-breaking hotel revenues, demonstrating that visitors continued to spend strongly and were willing to pay higher rates for accommodations.
As the busiest tourism quarter of the year, Q3 continues to play a vital role in supporting local businesses, attractions, events, and communities across the region.
Hotel Occupancy Remains Strong
Hotel occupancy averaged 81.5% during Q3 2026. While this was slightly below the 83.3% recorded in both 2024 and 2025, hotels still experienced high demand throughout the peak summer season.
August was the strongest month, with occupancy reaching 83.6%, followed by 81.8% in July and 79.2% in September. Although occupancy has softened somewhat over the past few years, these levels indicate that the region continued to attract a significant number of visitors during the summer months.
Record Hotel Revenue
The key story of Q3 2026 was hotel revenue. Total hotel revenue reached a record $144.1 million, surpassing the previous high of $133.9 million in 2025 by 7.6%.
Revenue increased across all three months of the quarter:
- August: $52.5 million
- July: $47.6 million
- September: $43.9 million
This growth shows that even with slightly lower occupancy, hotels generated more revenue from each guest stay, resulting in the strongest financial performance on record.
Higher Room Rates Driving Growth
A major contributor to revenue growth was the increase in hotel room rates. The Average Daily Rate (ADR) reached $209.56 in Q3 2026, up from $196.28 in 2025 and $189.73 in 2024. This represents nearly 7% year-over-year growth. In comparison, Toronto Hotels ADR was up 10% YOY to $308.
August recorded the highest average room rate at $223.87, while rates averaged $200.35 in July and $204.45 in September.
These results suggest two things: 1) that visitors continue to see value in our region’s tourism experiences and are willing to pay premium rates during peak travel periods, and 2) are using hotels throughout the region as the hub for their GTA trips.
Strong Revenue Performance Across Available Rooms
Revenue Per Available Room (RevPAR), a key measure of hotel performance, averaged $171.02 in Q3 2026, the highest level in the four-year reporting period.
This exceeded:
- $163.67 in 2025
- $158.28 in 2024
The increase in RevPAR demonstrates that hotels are generating more revenue from their room inventory despite slight declines in occupancy.
What This Means for Tourism Stakeholders
The Q3 hotel data reflects a tourism economy that remains healthy and resilient. Record revenues, higher room rates, and strong RevPAR performance point to continued visitor spending that benefits accommodations, restaurants, retailers, attractions, event organizers, and of course, our local municipalities.
At the same time, the gradual decline in occupancy warrants attention. It may signal increased competition, changing visitor travel patterns, or growing sensitivity to rising travel costs. Continuing to invest in destination marketing, major events, and shoulder-season tourism opportunities will be important to sustain visitor volumes while maintaining strong economic returns.
There is also an opportunity to push being the “hub” of trips not centred specifically on the municipality the hotel is in. For example, Oshawa can position itself to people in Kingston and Ottawa as the perfect hub for a trip that includes several activities in downtown Toronto. Sure, the visitors will head into Toronto and other areas during their visit, but they will also most likely eat and shop in Oshawa as well.
Overall, Q3 2026 continues to be an extremely high-value tourism quarter for our region. While hotel occupancy was slightly lower than in previous years, the region achieved record hotel revenues and posted its strongest ADR and RevPAR results to date. These results highlight the ongoing strength of the tourism sector and its important contribution to our visitor economy.
Click on the regional hotel reports below to see the Occupancy, Revenue, Average Daily Rate and Revenue Per Available Room for:
Please note: Daily & Weekly Occupancy % data is also available, providing a more detailed view of demand patterns throughout the year. Check it out here.
For further assistance in identifying your target markets, please contact Tom Guerquin, Manager of Research & Development at Central Counties Tourism.
Central Counties Tourism collects aggregated quarterly hotel data from Co-Star for the available properties within our region, and each quarter, share those metrics with you. Headwaters-specific data is not published separately due to limitations in the available dataset, but it is included in the aggregrated Central Counties Tourism dataset.