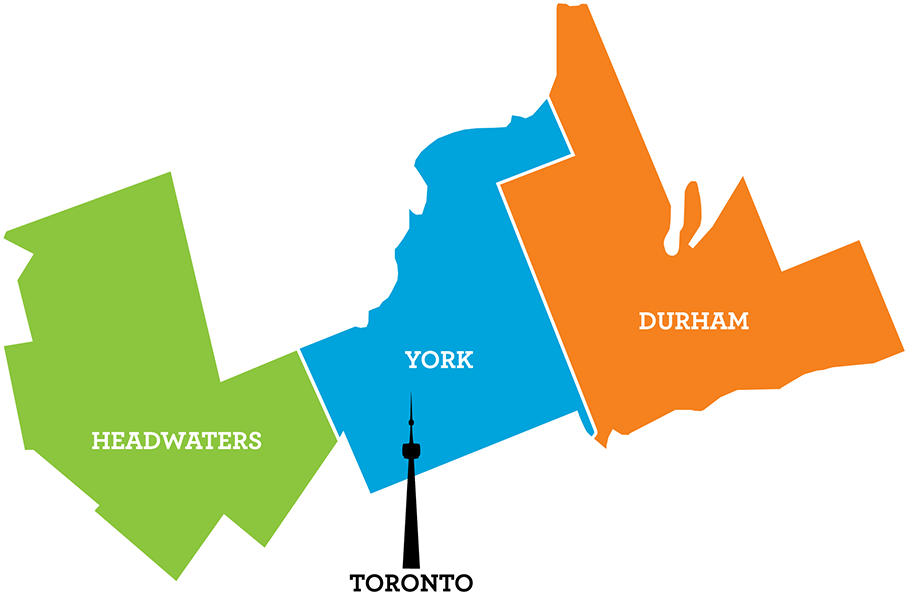
In 2025, visitors spent $3.7 Billion in our region — a 6.6% increase from 2024.
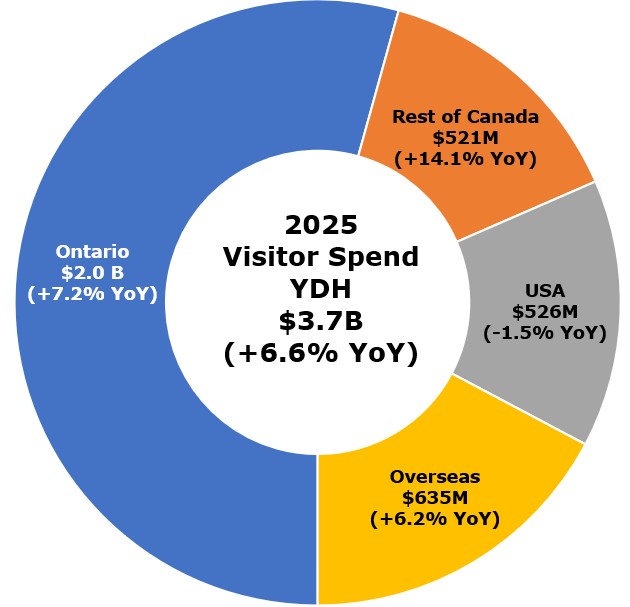
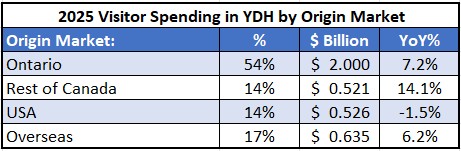
Visitor Spending in YDH by Origin Market
Source: Estimated spend data is derived from Destination Canada’s Lodging Aligned Spend Reporting (LASR) (February 27th, 2026).
Use, distribution, or republication of these estimates requires Destination Canada’s written consent.
It is safe to assume that the majority of visitor spend in our region is coming from Ontario, because it is, but only at 54% with a 7.2% Year-over-Year increase. The rest of Canada contributed 14% with a 14.1% YoY increase. Overseas market was at 17% with 6.2% YoY increase. Whereas, Americans contributed 14% with a 1.5% YoY decrease. Though the decline in USA spend was only -1.5%, the current political environmental might be the reason.
Ontario (Biggest market)
- Makes up 54% of all visitor spending ($2.0B)
- Grew by 7.2% YoY
- This is our most reliable and highest‑volume market
Rest of Canada (Fastest-growing domestic segment)
- Makes up 14% of spending ($521M)
- Grew the fastest at 14.1% YoY
Overseas Visitors
- Account for 17% of spending ($635M)
- Grew 6.2% YoY
- A healthy, consistent growth segment.
United States (The only market in decline)
- Makes up 14% of spending ($526M)
- Down 1.5% YoY – Too soon to tell if this is a trend of a result of current USA politics
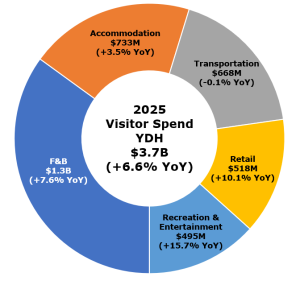
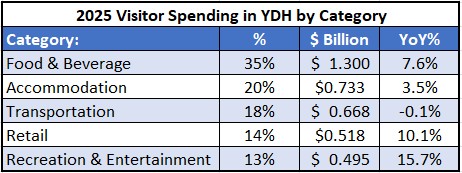
Visitor Spending in YDH by Category
Source: Estimated spend data is derived from Destination Canada’s Lodging Aligned Spend Reporting (LASR) (February 27th, 2026).
Use, distribution, or republication of these estimates requires Destination Canada’s written consent.
Understanding what visitors buy helps us see where the demand is and what we should offer or promote either as the main product or add-on sale.
Food & Beverage (Biggest spending area)
- The largest category at 35% of all visitor spending ($1.3B)
- Grew by 7.6% YoY
- Our visitors really love the F&B services/products that are offered, and is the largest driver to spend money on with over one third of total 2025 spend.
Recreation & Entertainment (Fastest-growing category)
- The smallest category of spend at 13% ($495M)
- However, the category had the highest YoY growth at a massive 15.7% YoY
- Shows visitors want “experiences,” not just accommodation.
Retail
- Account for 14% of spending ($518M)
- The second highest YoY growth at 10.1% YoY
- Another strong category tied to experience and convenience.
Accommodation
- Account for the second largest category at 20% of spending ($733M)
- A slow growing category at 3.5% YoY
- This means stays aren’t increasing as quickly as spending on activities.
Transportation
- Makes up 18% of spending ($668M)
- Its YoY change is slightly below flat at –0.1%
- In 2025, No major gains or losses; however, inflation and gas prices might play a major role in 2026.
Strategic Recommendations
1. Lean Into the “Experience Economy”
Recreation and entertainment are growing the fastest.
What to do:
- If you offer accommodation: bundle rooms with tickets, tours, spa services, or special activities.
- If you offer attractions: focus your marketing on the experiences, not just the product (e.g., “memorable”, “unique”, “immersive”).
2. Focus More on Canadian Travelers
Ontario + the rest of Canada = 68% of all visitor spending and both groups are growing.
What to do:
- Target Ontarians with staycation ads.
- Target other provinces with getaway campaigns.
- Since USA spending is shrinking (possible trend for a few more years), consider shifting some international marketing budget toward domestic ads.
3. Use the strong F&B category to partner with other categories
Over one-third of our visitor spend is from F&B providers, and combining this category with Recreation & Entertainment, Retail or Accommodation bring visitor spend up to 48-55%.
What to do:
- Build partnerships:
- Hotels ↔ restaurants
- Attractions ↔ restaurants
- Retail ↔ restaurants
- Attractions ↔ Retail
- Bundle gift cards, vouchers, and local products into packages.
- Retail businesses should focus on visitor-friendly items (local goods, shipping options, bundled souvenirs).
4. Capture More Spending During the Visit
Accommodation spending is not growing as fast as F&B and attractions. This means visitors are willing to spend — just not necessarily on rooms, despite growing Average Daily Rates.
What to do:
- Add more on‑site experiences or upgrades.
- Make it easy for visitors to add food/drinks, tours, and activities during booking or check‑in.
- Promote add-ons early, since visitors may only stay a short time.
If you have any questions or are interested in Visitor Research, please connect with Tom.