Quarterly Hotel Update, as of September 2023 (Q3)
Central Counties Tourism collects aggregated quarterly hotel data from Smith Travel Research (STR) for the available properties within our region, and each quarter, share those metrics with you.
The third quarter 2023 hotel stats are in, and we are happy to report that those numbers continue to surpass the 2019 (pre-COVID) figures. In this update we continue to focus on Hotel Occupancy percentages in 2023, Year-to-Date averages, and 2023 vs 2019.
2023 Occupancy Key Highlights:
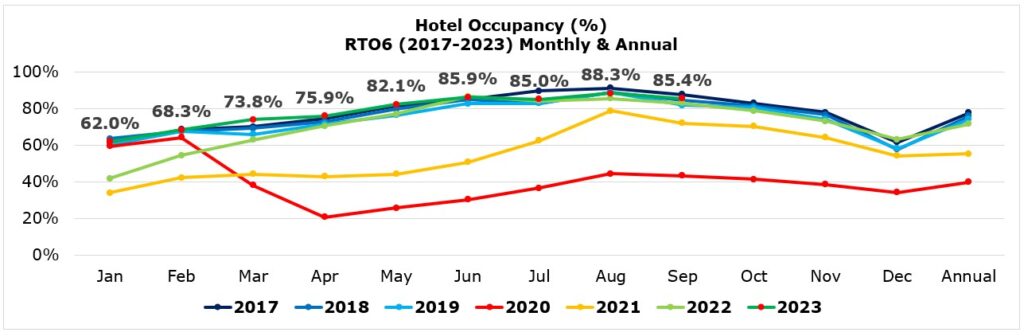
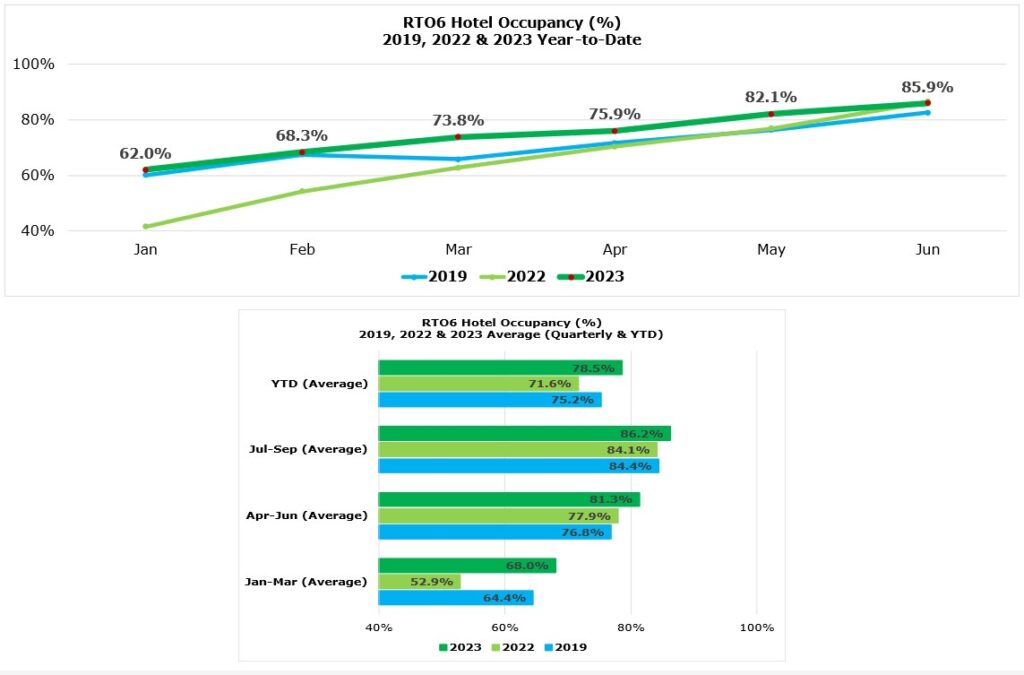
- Historically, Q3 experiences the highest of volume of overnight visitation into the region, and 2023 Q3 was pleasantly no exception. It was a busy summer for the region, the average occupancy percentage for Q3 was 1.8% higher than the same time period for 2019; occupancy levels in 2023 are returning back to pre-COVID year and are mirroring usual seasonal travel patterns.
- Year-to-Date comparisons: though a monthly comparison might have slight gains/losses, a YTD analysis gives a holistic view of the year’s current state vs the same time period for the 2019 (pre-COVID) occupancy levels:
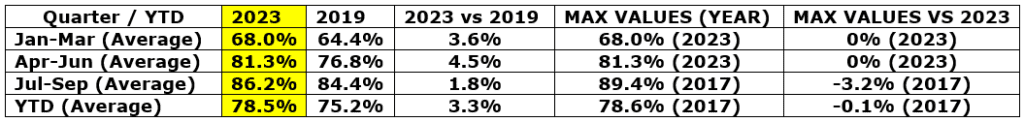
- 2023’s Average YTD is actually 3.3% higher than 2019’s Average YTD – indicating the aggregated occupancy levels for the region had more hotel rooms filled than before COVID (despite the higher cost of living and impact of inflation).
- When comparing the 2023’s Average YTD data to the highest values from previous years (from 2017 – the earliest time of reporting collected by CCT), 2023’s YTD value was only 0.1% below the highest record year (2017).
- Overall, the data appears to be pointing towards a very strong year for the hotel sector, as 2023 has been consistently performing better than past years!
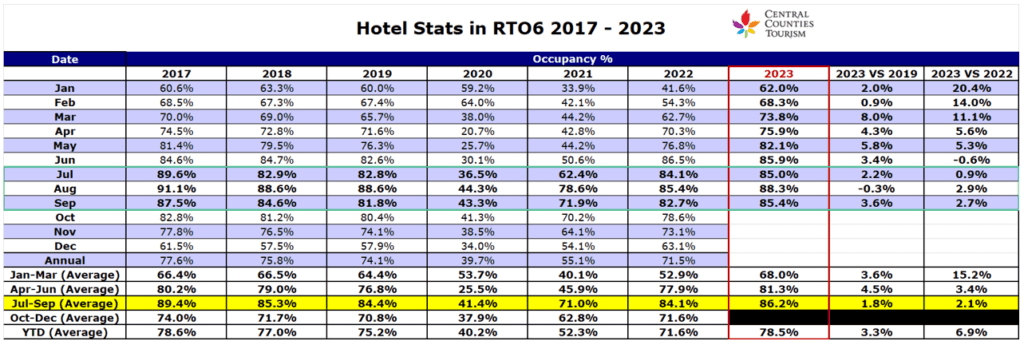
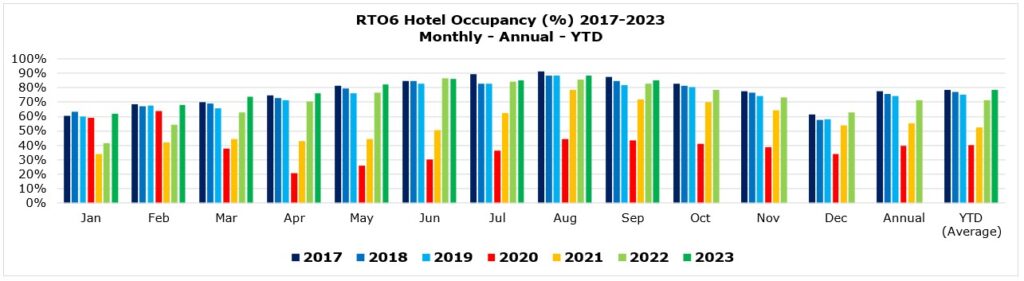
RTO6 Hotel Occupancy (%) for 2019, 2022 & 2023 Year-to-Date & Average (Quarterly & YTD)
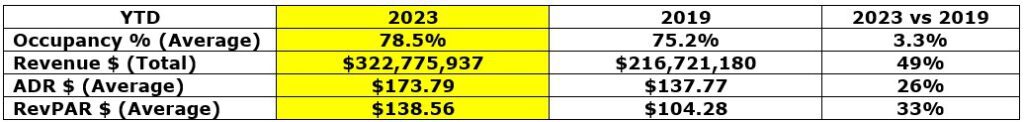
The other hotel variables (Revenue, Average Daily Rate (ADR) and Revenue Per Available Room (RevPAR)) are also up and actually are the highest in our reporting history; however, these numbers are significantly impacted by inflation, making Year-Over-Year direct comparisons problematic, especially to pre-COVID years. Figures are included below, nonetheless.
- The Year-to-Date Average Occupancy % increased 3.3%, from 75.2% in 2019 to 78.5% in 2023
- Total reported Hotel Revenue into the region’s participating properties grew by 49% from $216,721,180 to $322,775,937
- The Average Daily Rate (ADR) is up by 26% from $137.77 to $173.79
- And lastly, the Average Revenue per Available Room (RevPAR) has increased by 33% from $104.28 to $138.56.
Click on the regional hotel reports below to see the Revenue, Average Daily Rate and Revenue Per Available Room for:
For further assistance in identifying your target markets, please contact Tom Guerquin, Manager of Research & Development at Central Counties Tourism.