Research 101 Series
Part 2: Ranking Areas
Last month, we covered Distance Decay: why it’s important, how to read it and how to use it to grow your business. This month we continue the Research 101 series by focusing on the ‘Ranking Area’ report.
The Distance Decay report is always the first report we run. Similar to building a house, it is the foundation and tells us the number/percentage of locals vs visitors (40km+) and the distances they travelled. However, the ‘Where’ is missing from this type of report. Similar to building a house, we start with the concrete foundation (Distance Decay), and once the concrete is set and the floor is leveled, we build the walls (Ranking Area).
What is a ‘Ranking Area’ report?
A ‘Ranking Area’ report is simply a list of where your visitors are coming from, ranked in descending order from areas with the highest visitation to lowest.
We can look at ranking from four different geographic areas:
FSA:
This is the first three digits of your postal code. FSA stands for Forward Sortation Area (in case you were interested). This is the smallest geographic area we are able to report and also, through other reports which you will learn about later, can provide a great deal of demographic and psychographic information about the people visiting your location.
Census
Sub-Division :
This measures the amount of unique visitors coming from a specific municipality. It provides a great snapshot of where you are driving traffic from.
Census Division:
If you are measuring at the Census Division, you are learning which region people are visiting from. This is not typically used by any of our stakeholders, but could come in handy when trying to measure the impact of large-scale events that are drawing visitors from across Canada.
Province:
We have never run a report measuring the province people are visiting from for our stakeholders because most of them are drawing the vast majority of their guests from within Ontario.
Why is ‘Ranking Area’ important?
A Ranking Area provides us the following key insights:
- Identifies where your visitors are coming from by count and percentage of your total visitors – broken down by the ‘ranking area’ you choose.
- Each row of data validates your key target markets and recognizes secondary markets that might not be top-of-mind for your marketing department to promote to.
- It shows what percent of the total households within each geographic area that visited your location each year. This info can also help you increase your market penetration in your identified key areas and rank their importance by count, percent and percent penetration.
- The Ranking Area report allows you to laser focus your marketing efforts down to the FSA level. Rather than spending your entire budget on promoting your business/municipality to an entire city (e.g., Toronto), the data in this report will direct you to which pockets of the city you should target and how much of the city/FSA you are penetrating.
How do I use information from this report?
- The Ranking Area report is your proof of where your visitors are coming from, rather than using anecdotal stories to select the right markets.
- In addition to identifying your markets, it ranks and prioritizes them to ensure you spend your marketing budget effectively.
- The report validates your ‘key markets’.
- It also identifies markets that you might not have considered as your secondary markets.
- Geofence-based Ranking Area reports, rank your markets for the entire year; however, we can also rank your top 20 markets by month, if requested. This additional level of data helps you identify the seasonality by market, ensuring you’re targeting the right market at the right time.
- Essentially, a Ranking Area report will demonstrate where you should spend your marketing budget to increase visitation (and market penetration) to your business/event/location via various marketing channels and especially those that use geotargeting (type of advertising where you create ads that are based on your visitor’s geographic locations; i.e., Facebook ads, Google ads, Radio ads, Newspaper inserts, etc.).
How do I read a ‘Ranking Area’ table?
The top two rows in the table are the same as in the Distance Decay table.
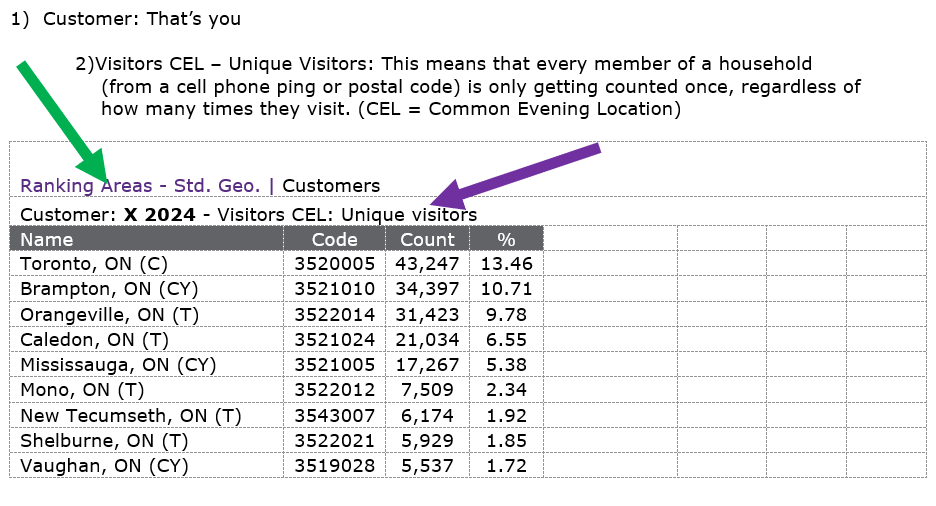
Next, we will dissect the data set.
Name:
Will tell you where they are coming from. The above example is by City (Census Subdivision). You will see a later example that has the first three digits of a postal code (FSA).
In case you were interested:
(C) stands for Large City
(CY) stands for City
(T) stands for Town
(TP stands for Township
Code:
Don’t worry about it. It is a code assigned by Stats Canada and has no bearing on the data.
Count:
This is the number of unique households within the specific geography that visited the area we want information on. The chart is decending based on the highest number in this column. For the above chart, this means that the highest number of people came from Toronto.
%:
This is the percentage of the total unique visitors to your location from each area. 13.46% of total unique visitors to the location above are from Toronto.
Understanding Base Counts
In order to understand Base Counts, you must first understand benchmarking – a term used to describe the entire geographic area you want to include when analyzing the data. It provides a number called “Base %” which is the total number of households within each Ranking Area – as shown in the charts below under Name – divided by the total number of households within the Benchmark area you choose.
In the first two examples, the stakeholder chose to use all of Canada for their benchmark, interested in knowing where all of their visitors were coming from. This produces a report with hundreds and hundreds of rows, capturing every visit.
In the last example, the stakeholder determined that since 97% of their non-local visitors came from between 40km and 100km from their location, they would use that area as their benchmark. Best practice for accurate and actionable data is to make the benchmark at a distance that captures 95% of your overall non-local visitors.
Ranking Cities (Census Subdivisions) by Top 10 & Bottom 10 in Canada to your location

To view the full Ranking Areas report in PDF format, click here.
The above chart includes all of the datasets that the Ranking Area Report provides. You will notice that the first four column headings from left to right have already been explained above in the ‘How do I read a ‘Ranking Area’ table’ section. The final four headings provide you with additional insights. This is an example of a report that identifies visitors from across Canada. It includes hundreds of rows of cities, but we are only showing you the top and bottom 10 so you can see how it works.
Base Count:
This is the TOTAL number of households within each specific geographic area.
Base %:
This column represents the percentage of households in that specific geographic area (row) against the entire benchmark (the total housholds in Canada, which is 32,445,715).
In the example above, the benchmark is Canada. It tells us that there are 2,611,953 households in Toronto and the ‘Base %’ represents 8.03% of total households in Canada. If the benchmark was changed to Ontario, the ‘Base %’ value would change to reflect the total households in Ontario (the new benchmark), and changing the Toronto ‘Base %’ to 20.43% (2,611,953 ÷ 12,782,786, the total number of households in Ontario).
% Pen(etration):
This is the percentage of total households within each specific geographical area that visited the area we want information on, essentially, what % of the ‘Count’ of your unique vistors are penetrating the ‘Base Count’ (‘Count’ ÷ ‘Base Count’) of households within each geographic area.
Note: There are times when % Pen is great than 100 and that is because the Base Count is the number of households and the Count is the number of unique visitors. If four people from one household visited, that is a Count of four from one household.
Index:
Measures if the households in the specific geographic area are more or less likely to visit the area of interest when compared to the benchmark. An Index of 100 is average. Indices above 100 are above average or over-represented. Indices below 100 are below average or under-represented.
Putting it all Together – Census Subdivision Reports
Below are the top 10 rows of a Ranking Area (Census Subdivision, City level) report. Let’s take what we just learned to analyze what it is telling us.

- As this report is a Ranking Areas report of where your visitors are coming from, it is sorted by the ‘Count’ column in descending order.
- This report validates and ranks your key target markets that you should promote your business/destination to, the size of that specific market (Base Count), and how much of it you are you currently penetrating (%Pen).
- It also identifies markets you might not have been aware of, and, now have the data to validate and allocate a portion of your budget to promote to those areas and increase their penetration. For example, visitation from Toronto, Brampton and Mississauga is not surprising, but without the data, you might not expect that this area received visitation from 7,509 households in Mono with a 82.13% penetration
- Since the customers in this report are ‘Unique Visitors’, they represent one cell phone ping or one household. In some cases, a person might have more than one cell phone and that additional device is counted in the ‘Counts’ column; resulting in a higher count than the number in the ‘Base Count’ column (the %Pen would then be over 100% as shown with visitors from Orangeville and Amaranth in the above example).
Putting it all Together – FSA Reports
In the next example, we are now looking at Top 10 FSA’s (first three letters of Postal Codes) and using households between 40 and 100km as the benchmark, as the he Distance Decay report identified that 95%+ of all visitors came from within this area.
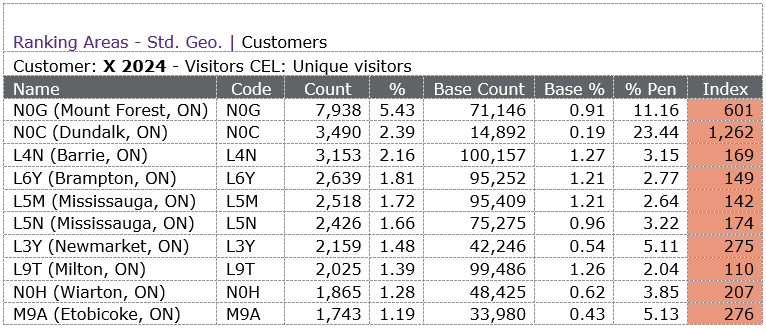
This report looks essentially the same as the previous examples – the only difference is the geographic area being ranked, FSA vs Census Subdivision, as displayed in the ‘Name’ column. Instead of ranking by the City name, now results are ranked by the FSA. The municipality and province of the FSA appears in brackets, providing a clearer picture as to its corresponding location: N0G (Mount Forest, ON).
Let’s take a deeper look at the second and third highest visitor counts – NOC (Dundalk) and L4N (Barrie).

Here is what the data is telling us:
- Almost a quarter (23.44%) of all households in NOC visit the location being studied.
- Only 3.15% of all households in L4N visit the location being studied.
- The difference in the actual number of visitors is less than 350.
- L4N has almost seven times as many households as NOC (Base Count).
Based on this knowledge, you can make decisions that are right for your organization. For this example, here is what I would do:
- Using the consumer profile data (you will learn more about this in an upcoming article), I would figure out the types of people that live in NOG (the top FSA) and NOC. I would then find other FSA’s that have the same type of people and laser target them with messaging.
- I would also target L4N with messaging because there is a lot of growth potential and lots of residents in that FSA are already visiting. Could produce a good ROI.
The three key questions you should always ask yourself are:
- Which Cities/FSAs are more of my visitors coming from? (Count & %)
- Which Cities/FSAs do I currently have a high penetration in? (% Pen)
- Which Cities/FSAs have the most growth potential? (Base Count)
It is important to note that when you compare and try to prioritize your key markets, like N0C vs L4N, the answers to the three questions above might have the same answers or they might be different.
Give it a try
Based on what you have learned so far; there are two FSAs in the above table from Mississauga, L5M and L5N. If you only have budget to market to one FSA in Mississauga, which one would you select? And why that one? Hint: there is no wrong answer.

Please take 5 min to make your selection.
In my opinion, this one is a close race. I broke it down into Pros and Cons.
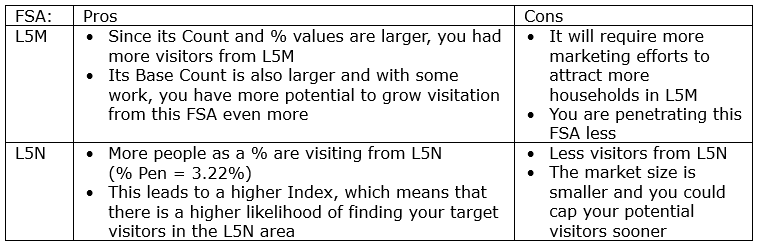
So, the honest answer is “it depends”.
- With some additional marketing, you can increase visitation from L5M as there are more households in L5M, a larger pool.
- Though, you are penetrating the L5N market more and it is your ‘lower’ hanging fruit.
My pick is to spend the money and energy to increase your marketing efforts in L5M to increase your market penetration for future visitation.
Tourism research is a marathon, not a sprint, and as you may already know, one question and its answer will often lead you to several additional questions.
If you have any questions about this, other research, or data in general, feel free to contact Tom.
Written by:
Tom Guerquin