Quarterly Hotel Update, as of December 2023 – Demand in 2023 surpassed 2019 by 3%!!!
Central Counties Tourism collects aggregated quarterly hotel data from Smith Travel Research (STR) for the available properties within our region, and each quarter, share those metrics with you.
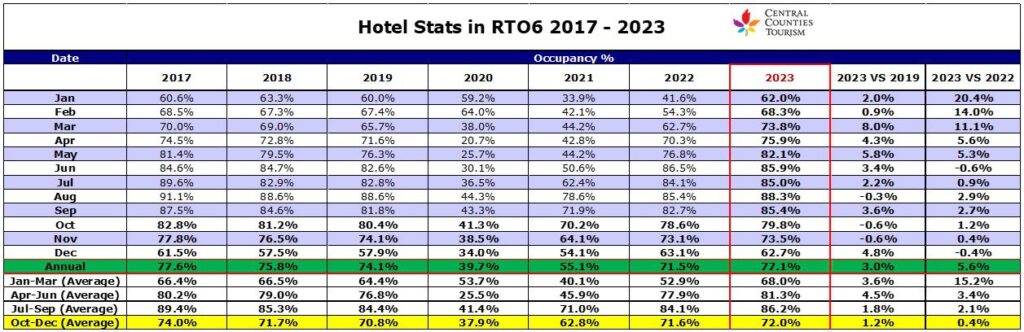
The final 2023 hotel stats are in, and the aggregated CCT hotel occupancy % for 2023 is 3% higher than 2019!
In this update, we continue to focus on Occupancy percentages in 2023, 2023 vs 2019, and 2023 vs historic values for annual and quarterly data.
2023 Occupancy Key Highlights:
The table below shows occupancy % levels for the following comparisons: 2023, 2019, 2023 vs 2019, 2023 vs the average of pre-COVID years (2017-2019), the max occupancy % (YEAR), and 2023 vs the max occupancy values.
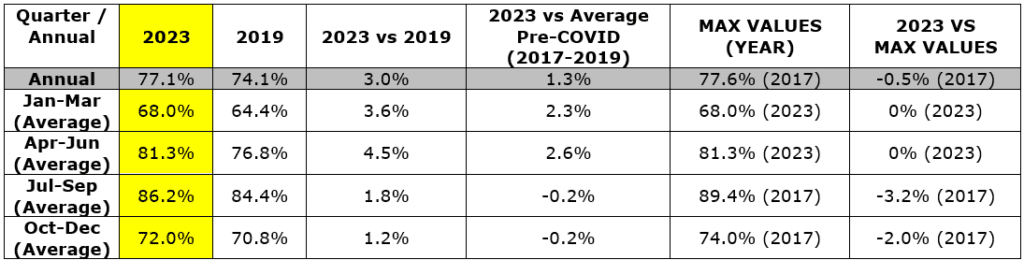
- 2023 Annual Data
- Overall, the data indicates that demand for overnight accommodation into the region has returned to pre-COVID levels, even surpassing previous records, and finishing 2023 with an annual occupancy level of 77.1%! This is a 3% increase from 2019, and only down by 0.5% from the highest reported % occupancy, for CCT collected data, in 2017.
- 2023 Quarterly Data
Average quarterly data provides a holistic view of which seasons are underperforming, on par, or overperforming in terms of overnight demand in the region and identifies opportunities to create additional programming to boost demand for overnight accommodation.
- Historically, Q1 (January-March) is the region’s off-peak season with the lowest occupancy percentages vs the other quarters, though occupancy for Q1 2023 was 3.6% higher than in 2019 and has the highest occupancy % since reporting (in CCT) started in 2017.
- Q2 is the shoulder season before the region’s peak summer season, and 2023 also experienced record highs; Q2 2023 was 4.5% higher than Q2 2019.
- Q3, the peak season (July-September) had an increase of 1.8% over Q3 2019.
- Q4 (October-December) is the region’s second shoulder season, after a strong summer/early fall, and it was on par with pre-COVID numbers at 72% Occupancy (actually 1.2% higher than in Q4 2019).
- 2023 vs Average pre-COVID years (2017-2019)
- When comparing the seasonality of 2023 to pre-COVID years (2017-2019), occupancies in Q1 & Q2 2023 were 2.3% and 2.6% higher than the average Q1 & Q2 2017-2019, and occupancy percentages in Q3 & Q4 2023 were barely noticeable at only 0.2% lower than the average Q3 & Q4 2017-2019; indicating the dispersion of occupancy in 2023 has returned back to normal pre-COVID levels, with a 2% increase for overnight demand in Q1 & Q2 (particularly between March – June).
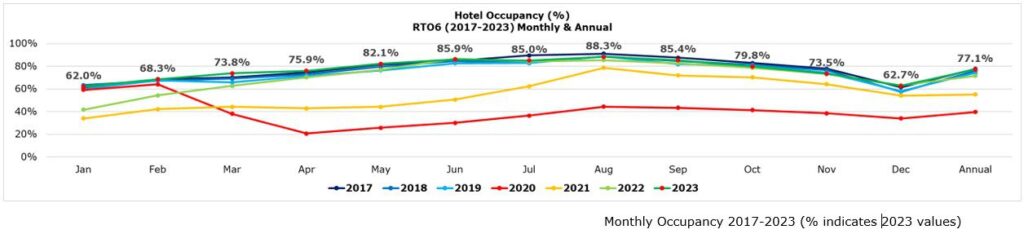
Monthly Occupancy 2017-2023 (% indicates 2023 values)
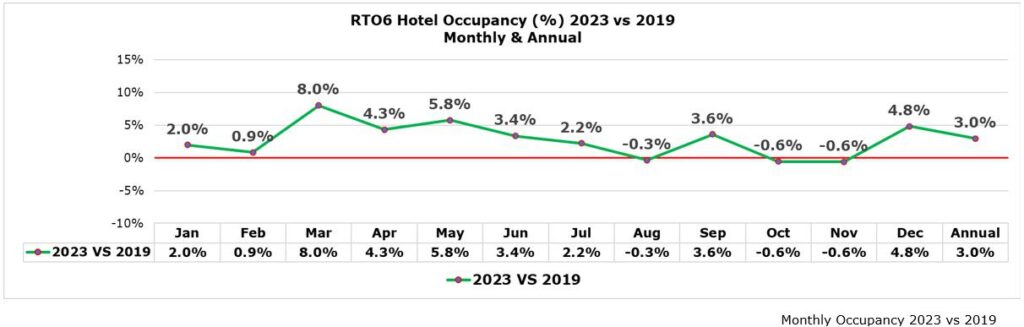
Monthly Occupancy 2023 vs 2019
The other hotel variables (Revenue, Average Daily Rate (ADR) and Revenue Per Available Room (RevPAR)) are also up and actually are the highest in our reporting history; however, these numbers are significantly impacted by inflation, making Year-Over-Year direct comparisons problematic, especially to pre-COVID years. Figures are included below, nonetheless.
- 2023 Total reported Hotel Revenue into the region’s participating properties grew by 48%
- 2023’s Average Daily Rate (ADR) was up by 27% from $136.67 to $172.99
- And lastly, 2023 Revenue per Available Room (RevPAR) increased by 31% from $101.92 to $133.35

Click on the regional hotel reports below to see the Occupancy, Revenue, Average Daily Rate and Revenue Per Available Room for:
For further assistance in identifying your target markets, please contact Tom Guerquin, Manager of Research & Development at Central Counties Tourism.