As Tourism Professionals, at some point in our careers we have all been asked the same question, “How is Tourism doing?”
From an outsider’s perspective, it sounds like a simple question. However, the answer is much more complex since tourism is a combination of several sectors all working together as one industry (i.e., accommodation, food and beverage services, recreation and entertainment, transportation, and travel services). Regardless of this, we have all answered the question to the best of our abilities.
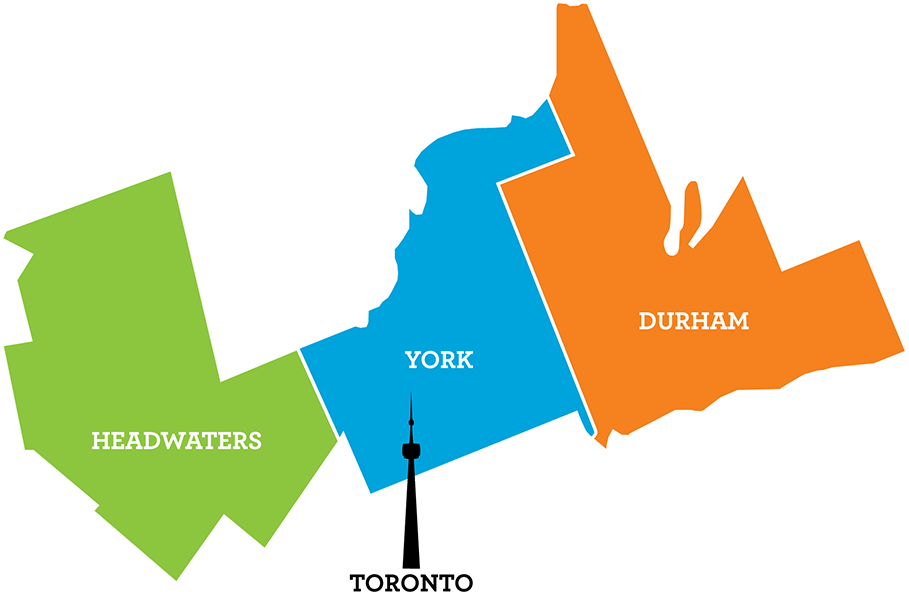
The response is relative to the person answering the question: a hotel employee could refer to their occupancy as a measurement of success; a restaurant could compare their sales/profits to the previous year; or the number of tickets sold by an attraction or tour operator. But for a Regional Tourism Organization (RTO) like Central Counties Tourism representing the Durham, York, and Headwaters regions, this question is more difficult to answer because it needs to take all of the sectors into consideration and calculate an aggregated answer.
This article is the first part of a three-part series, where we will use data to tell the tourism story and answer the question “How is Tourism doing in RTO6?” In part one, we will look at annual visitation from 2018 – 2020, based on visitors travelling 60km or more from their homes, and spending the night in our region. This includes visitors staying in a hotel, cottage, Airbnb, or with a friend or relative. By setting these specific parameters, we are able to count, compare, and analyze visitation consistently from 2018 and onward with real and timely data. Unfortunately, due to data limitation, day visitors are not included in the results.
Baseline
It is necessary to first establish a baseline for any future comparisons to know how we were doing in the previous year. Throughout the series, we will be using 2018 visitor data as the baseline, and looking at five key variables:
- Number of (unique) visitors – number of distinct travellers and only counted once during a specific timeframe
- Number of trips – the aggregated number of times the unique visitors stayed in the region
- Number of nights stayed – the number of total nights stayed in the region
- Average number of nights per trip – number of nights divided by number of trips
- Average number of nights per visitor – number of nights divided by number of unique visitors
2018
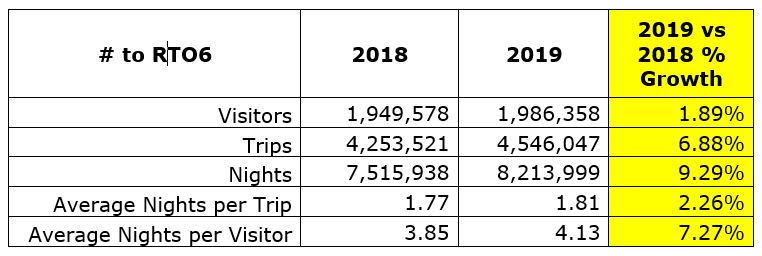
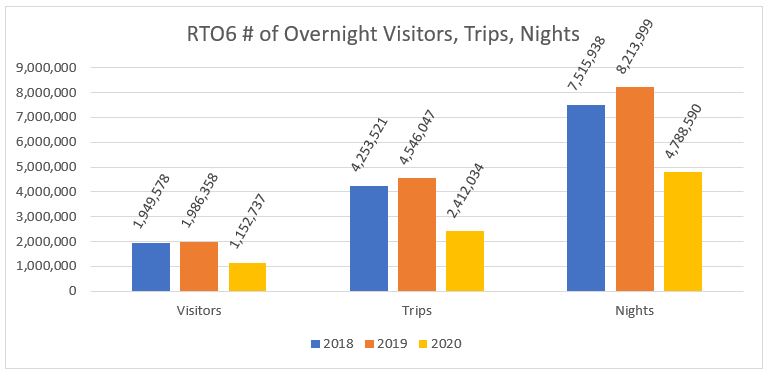
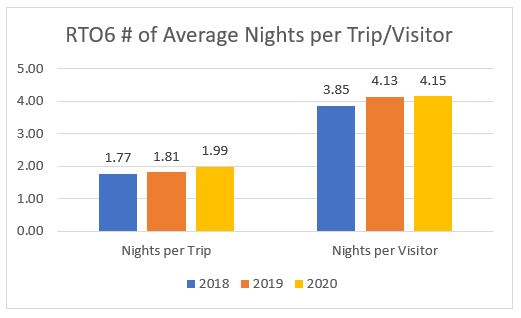
RTO6 saw 1.95 million unique overnight visitors into the region, who made a total of 4.25 million overnight trips, and stayed a total of 7.5 million nights. This produced an average of 1.77 nights per trip as the length of stay, and each visitor stayed on average 3.85 nights in the region in 2018.
2019
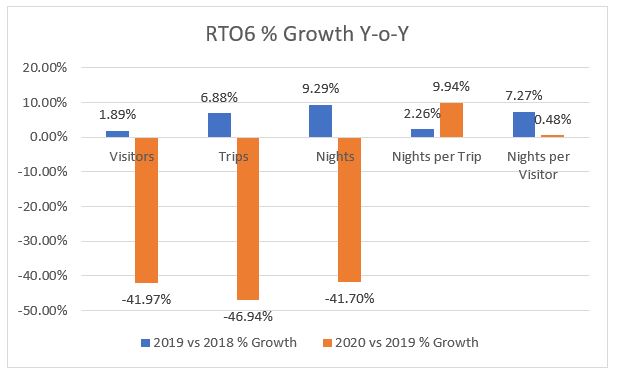
One year later, RTO6 had an increase of almost 40K unique visitors (+2% growth), nearly an additional 300K trips were made (+7% growth), and an extra 700K number of nights in total (+9% growth). This growth has also increased both the average number of nights per trip and nights per visitor.
The increase of all five key variables is largely due to your work and success in promoting your products, and delivering remarkable visitor experiences.
Our hotel data from 2016-2020 also confirms that 2019 was the best year in terms of revenue, with August 2019 being the highest. This was all made possible by working together to attract more Canadians in general to RTO6 in 2019, not just Ontarians. Together, we were able to showcase our incredible region and all of our assets, which resulting in visitors spending more money at your businesses, promoting it within their own networks, and then returning to enjoy more.
Ontario vs the rest of Canada
Based on our new Canadian visitation data, we are now able to calculate the breakdown in our visitation by province. RTO6’s overnight visitation is composed of approximately 80% Ontario, 10% Quebec, 3% Alberta, 3% BC, 1% Manitoba, 1% Nova Scotia, and the rest of the Provinces and Territories make the remaining 2%.
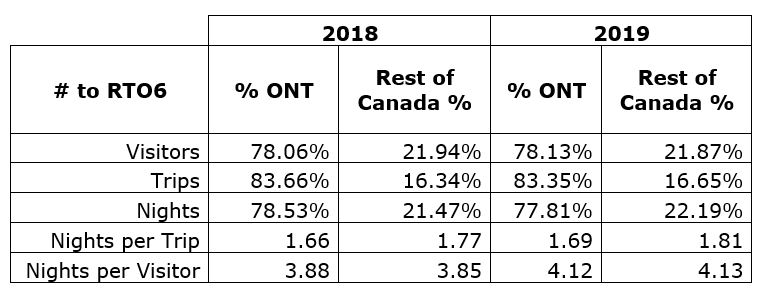
This table shows us two interesting points that resulted in additional revenue in your pockets from the previous year:
- Ontario visitors
The per cent of unique visitors in 2019 within Ontario has increased, indicating that 30K new visitors decided to either take a new overnight trip and stay in RTO6, or change their 2018 RTO destination to RTO6 in 2019.
- Rest of Canada visitors
Though the overall per cent of unique visitors in 2019 outside of Ontario has decreased, RTO6 still attracted 6.8K new visitors in that year, and all of the other variables increased too. This indicates that those out of province visitors came back into RTO6 multiple times for more trips, and slightly increasing their nights per trip. This also suggests that they decided to take a new trip and then picked RTO6 as their top destination of choice, and/or changed their 2018 trip itinerary in favour for RTO6 in 2019.
2020
It is both hard to talk about 2020 and not talk about it at the same time, like the ‘elephant in the room.’ Tourism was hit especially hard in 2020, and COVID-19’s impact is still being felt in 2021.
Despite the pandemic, two ‘State of Emergencies’, and all of the closures in 2020, RTO6 still saw 1.1 million unique overnight visitors, 2.4 million trips, and 4.8 million nights. These numbers were all 42-47% down in 2020 compared to 2019.
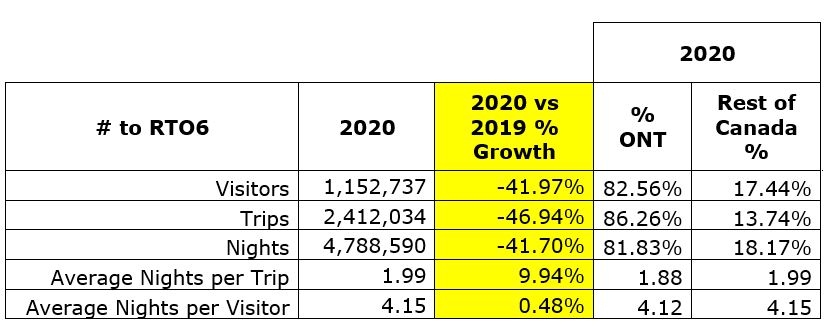
However, one positive stat that changed in 2020 compared to 2019 was the average number of nights per trip and visitor. This indicated that when visitors did travel into Central Counties, their length of stay per trip increased by 10% from 2019 (+12% from 2018), and each visitor stayed an extra 0.5% number of nights from 2019 (+8% from 2018).
Conclusion for Part One in this new research series
- Despite the current COVID-19 landscape, the 2019 data and especially its % growth over 2018 should be very comforting.
- “How is Tourism doing in RTO6?”
- Pre-COVID-19: Tourism in the region was thriving
- Over one year, the region saw almost 40K new visitors (+2% growth), the number of trips and total nights increased by 300K (+7% growth) and 700K (+9% growth)
- During-COVID-19: Overall, tourism in Ontario was hit hard, and the region was no exception to the impact felt by COVID-19.
- Moving forward, visitors will return because we have all done a great job in showcasing your businesses and region in the past!
- This resulted in more visitors picking RTO6 as their destination of choice, and increasing their number of trips and nights in the region.
- This also increased RTO6’s brand awareness by introducing and/or converting visitors to select our region for their overnight trips.
- Creating more revenue for the entire region.
- These findings should give us all hope for 2021 and 2022.
- And moving forward, we will continue to track these five key variables in 2021.
Below is a summary of annual overnight visitation to RTO6 2018-2020
Part Two will look at quarterly visitation data and where visitors are coming from.
If you have any question, please do not hesitate in contacting Tom TGuerquin@centralcounties.ca